Infographics are fun, right? I mean, who doesn’t like their data with a side of pictures?
The three here (plus one more) have been open tabs in my browser for weeks now. While I question some of their findings and methods, it’s in those questions that I see the opportunity to a deeper conversation about the work we’re doing, whose doing it, and why.
1. The (Australian) Achievement Gap
via Nancy Rubin, developed by Open Colleges
While focusing on the Australian perspective, this graphic strikes me as interesting to deploy into a classroom where (U.S.) students are investigating other cultures and attempting to make sense of charts/graphs.

2. Teachers Embrace Digital Resources to Propel Learning
via Josie, developed by PBS Learning Media
While the use of pie charts is questionable, dropping this graphic at the top of a faculty meeting or using it to start the development of a school or district tech plan could generate some great conversation. Of particular interest: How is what we see here reflected in our own learning space? What do we see that we want to know more about?

3. The Social Media Cheat Sheet
via Alex Shevrin, developed by Flowtown
Alex shared this in our ongoing conversation in our Antioch University New England / P2PU course on social media in education (come join), and I love it. I’ll be using it whenever I get the chance to talk to teachers about affordances and constraints of social tools in the classroom. If I were teaching right now, it’d also be a starter for a class conversation about how we could build things in class that were useful and connected to the outside world. Love it.

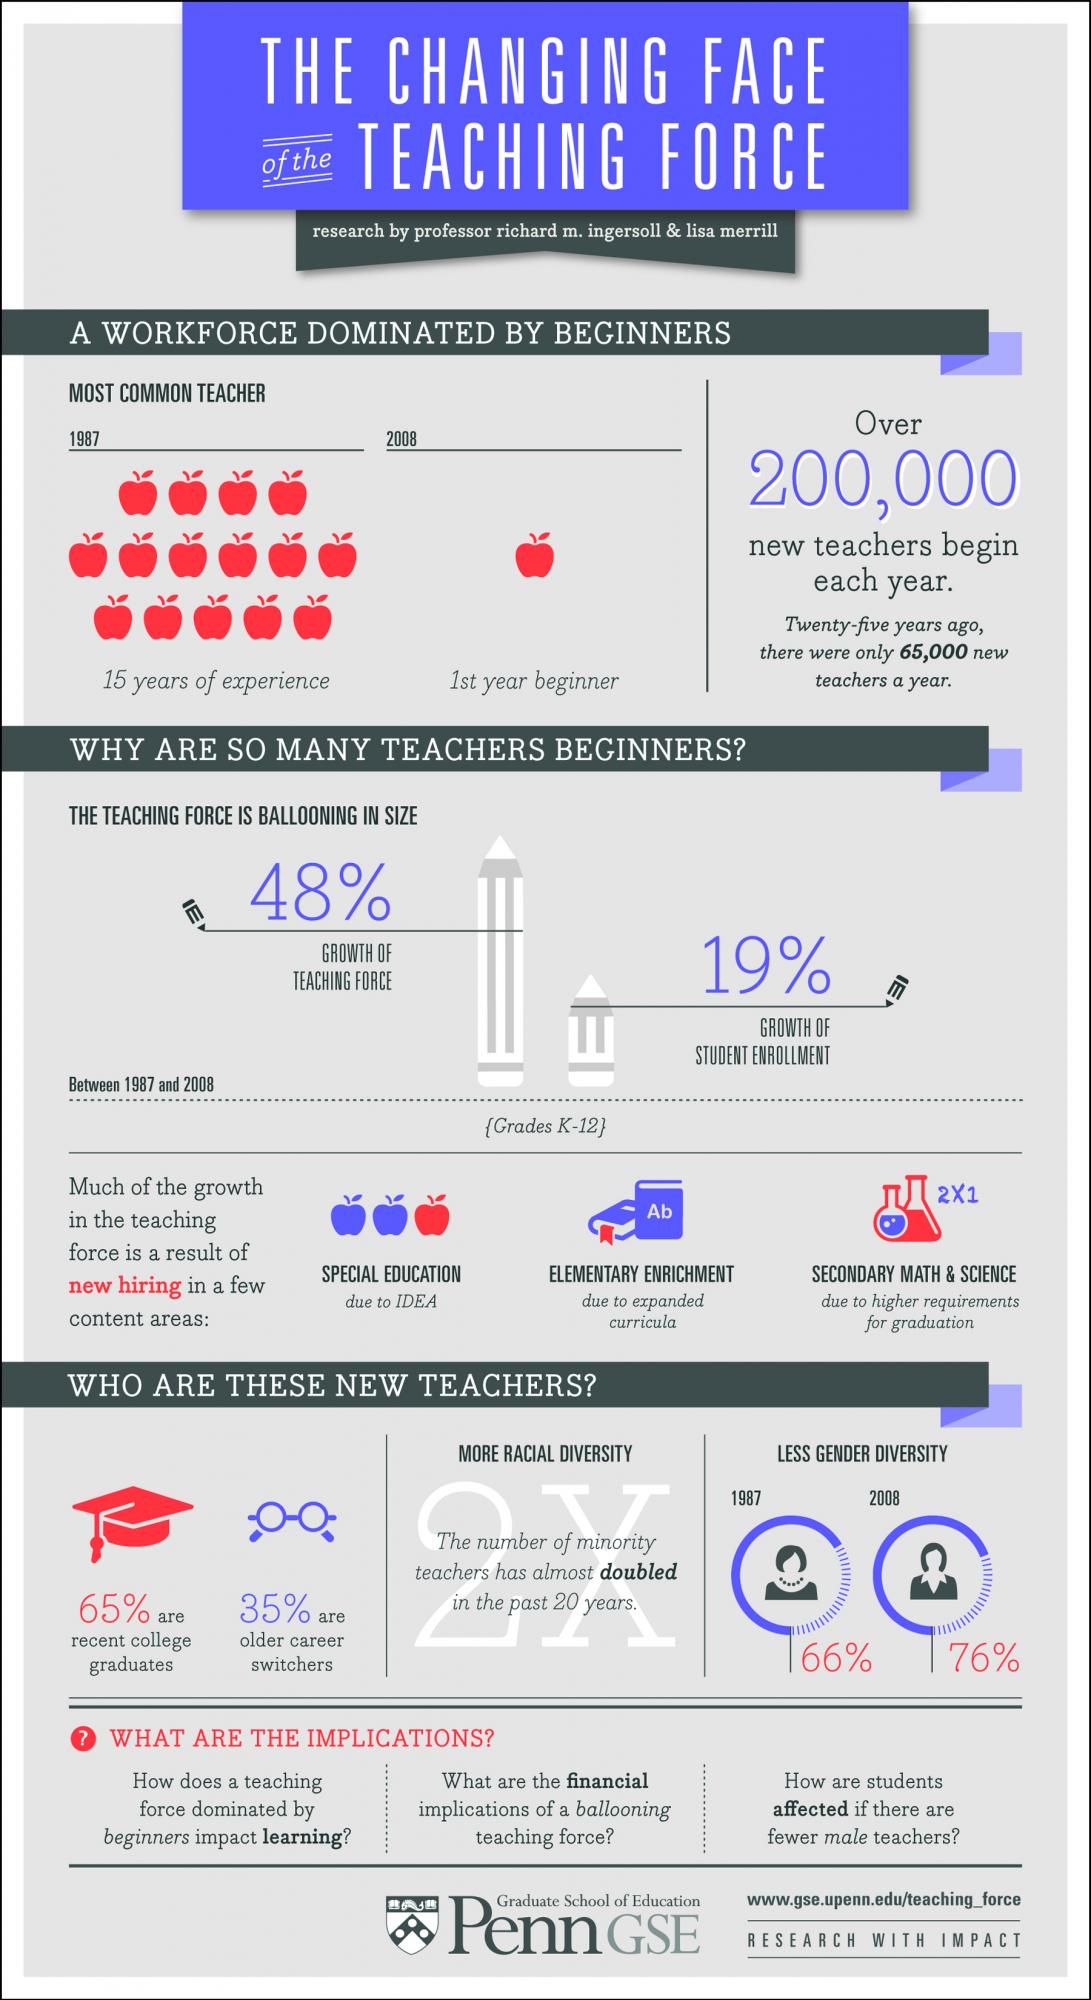
4. The Changing Face of the Teaching Force (I promised one more)
via Penn GSE, developed by Richard Ingersoll
One of the conversations I keep coming back to as I work with student teachers is, “What will your impact be in the classroom?” If you’re guessing I’ll be pulling in this graphic for one of our future seminars, then you are correct. Ingersoll’s work is presented in a provocative and consumable way, and I’ve had many conversations about what the shifts he highlights might mean for the shifting picture of the students in those classrooms as well. If I were working in a district HR office, this would be how I started thinking about hiring practices or examining what we already have in place.
